
How Much Should Companies Give Back?
A year ago, I regularly found myself saying things along the lines, “It’s only a few million dollars. Why do we need a signed approval for this?” I’d have a good laugh with my coworkers around the water cooler about how weird conversations like that were in the context of real life. About how nice it would be if we could just have us .1% back from our campaigns… We’d be set for life. When putting together the numbers for the business cases and sales campaigns inside one of the world’s largest companies, money meant something completely different there than it did at home.
I’ll never forget the first few weeks after I joined a scrappy new product development team with a great market outlook that couldn’t get the attention it deserved – we were bringing in tens of millions of dollars in revenue. I was impressed – I’d only worked in research and development. Which costs money. Making tens of millions of dollars sounded great. I quickly learned it’s not. It’s a rounding error for a $100 billion company. In the years to follow, I worked on and saw several multi-million- and billion-dollar business cases. Money continued to mean almost nothing at work. Or at least until it didn’t anymore.
I quit that job almost a year ago after deciding I was done trying to climb that corporate ladder. I wanted to take a chance going back to a field that helps advance the voice of people and pursue my PhD in Industrial-Organizational Psychology. However, I’m still a stakeholder through my 401K and I got a copy the annual report in the mail a few months ago. In it, I found a line touting how much it had given back to the community over the past ten years. I callously and sarcastically said to my husband, “Oh wow. They’re is so giving. They gave back $1.7 Billion over 10 years!” He quickly jumped to its defense, mansplaining to me that I was expecting too much. That it was a lot of money. That it was giving back enough. He’s right. $1.7B is a lot. But to me, $170M a year was laughable. I sat him down and gently, but firmly explained why…
In 2018 the company I worked for reported $101 billion dollars in revenue. For that same time period, they boasted giving $283 million dollars back to the community which is a measly 0.2% of revenue. Digging into the numbers a bit more… of the $1.7 billion over 10 years they took credit for in “community investment.” In only 5 of those years, the infographic points out that 10% of those donations came directly from employees donating their own money (which is tracked through the matching program). In fact 2018, 13% ($37.8M) of the donations the company took credit for in their announcement came directly from the pockets of employees. So no. I did not think that they gave back enough.
Then he asked me a question I’ve been grappling with since then: “So, how much should we expect companies to give back?”
I’m not completely sure what the right answer is… But I’m 100% sure 0.2% isn’t it. Since, I’m only intimately familiar with the deep pockets of one Fortune 25 company (and an analyst), I decided to check if this behavior was limited to the company that I knew or if it was part of a bigger trend.
I quickly stumbled across a 2015 list by Forbes: The 20 Most Generous Companies of the Fortune 500. That’s when I felt like I might be on to something… Second on the list was Walmart who gave a whopping 0.06% in cash donations as a percent of revenue that year. Each company I looked up showed similar trends. Of the top 20 biggest givers, just one donated more than 1% of revenue in cash. Gilead, a pharmaceutical company whose donations are tied to cash grants, a part of its business model.
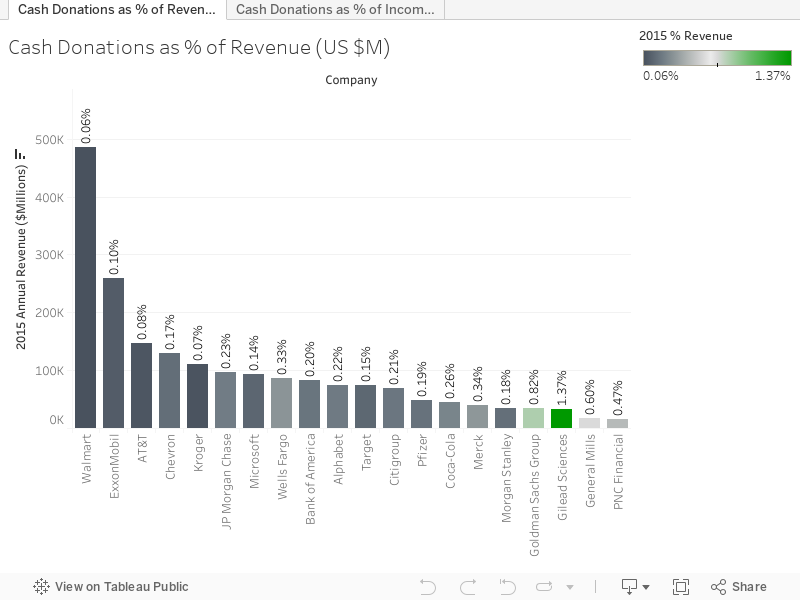
Some of you may be saying. “Well that’s not fair. You’re not including the other things that companies do. Walmart donates food and toys and stuff.” Ok. Fine. My metrics don’t have all of the in-kind donations – but sadly, it turns out most companies don’t report that metric. You have to pay to find out how much companies donate and it is not required for companies to report publicly. A few do though. So let’s pick on Walmart again. It’s the biggest company in the US in revenue and has an entire Wikipedia page dedicated to its impact on US communities and the economy. In 2018, Walmart stated that it gave back $1.08B in “cash and in-kind” to charity. But even when you consider that number, Walmart only increases its giving to 0.21% of total revenue last year.
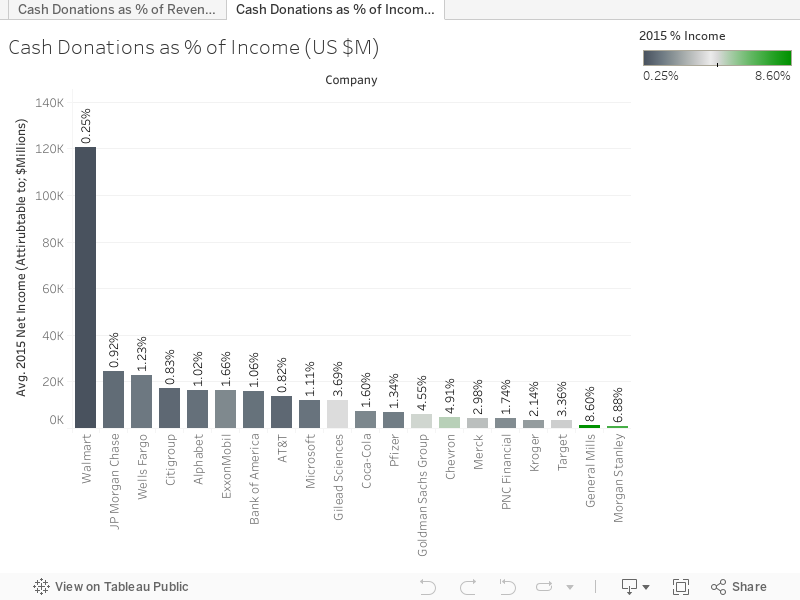
Next you might say, “Well big companies already give back to the community. They provide jobs and opportunities for employees.” You’re right. Big companies can do a lot of good. My old company’s willingness to educate their employees may be one of reasons why Seattle is one of the most educated cities in the country. Once you get in the door, you have access to so many opportunities and you can have a fulfilling and lucrative career. I can attest to that. For the 7+ years, between promotions and raises my income grew at just above 15% per year. I got to travel, go to conferences, trainings, and pursue a free graduate degree. So, to be fair, let’s only look at income rather than revenue, since income is what a company makes after it invests in its people…
Looking at income things get a little better, but not much. Walmart’s giving rate only increased to 0.25% of income. However, several of the companies on the list of biggest givers look a little better when you consider income. General Mills even got up to 8.6%. But for the majority, they still fell below 2%. These are the biggest givers in the S&P 500. So big companies do some good from this perspective, but could they do more?
Not everyone who works for a big company is taken care of. I sat with contract employees who were paid less than 25% of what full time employees earned doing the same work. I got to know an older woman who had been at the company for 35 years and found out she made just under half my salary. For many of my friends there, wage growth was stagnant. Half of people were forced into a performance grade that resulted in a wage increase below the 2.8% cost of living adjustment. Average performance raise pools were between 2-3% every year for most employees even when the company had record breaking profits. That meant that every year, my annual raise resulted in someone else on getting less than a cost of living adjustment. That never felt right or good. Even with my above average raises for me every year, my husband and I struggled for several years to pay our bills. His income grew at country’s average rate so when I quit my job, we were in the red every month before food. If I was struggling when my increases were above average, how were the people around me surviving let alone thriving?
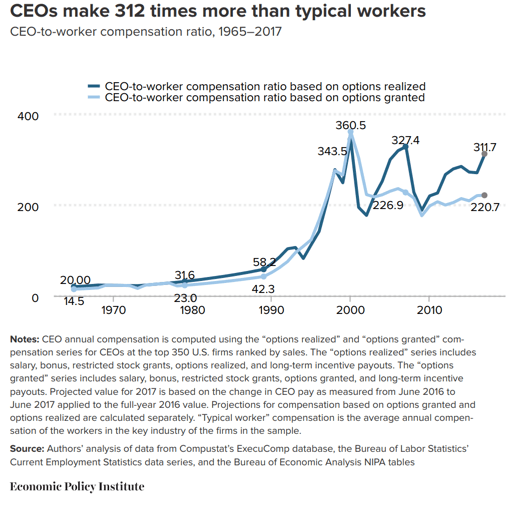
Again, this is not limited to one big company. Wages for most have grown at pretty low rates over the last several years. While corporate profits grew 16.2% last year, salaries rose only 3.1% on average. So where’s all that money that companies are making going? Looking at salary alone, executives have the same stagnant wage growth and it seems like their income is only growing at 3% as well. But with executive compensation surging due to stocks and options, the Economic Policy Institute estimates that CEO compensation actually grew at 47.1% between 2016 and 2017. And the average CEO now has realized almost 312 times the amount of the typical worker. This growing trend that separates the compensation of the people at the top from the average worker started skyrocketing in the early 90’s when I was around 5 years old. For almost my entire life, the gap between the wealthy and poor has been growing at unprecedented rates. But millennials are ruining the economy. Right?
Trickle-down economics is based on the premise that if companies and wealthy patrons have more money it will grow the economy through increased spending. That giving breaks to companies will benefit the everyday man. But that isn’t happening. My old company’s CEO came out last year and said that due to the $1 billion 2018 tax break, the company would be increasing its charitable giving. In fact, it would set aside $300 million in additional funds towards employee training and the community with $100M going to charity through increases in the employee matching fund. I remember the sting last year when we found out a massive tax break would only directly benefit people in the community if we, the people, gave more. Again, this was part of a larger trend. Most Fortune 500 companies didn’t commit to doing anything with the extra tax dollars last year. In fact, less than 5% of companies dedicated money toward wage increases after getting a massive tax deduction. Instead, in the same year, companies spent 154 times more on stock buybacks than the amount they spent on all workers’ bonuses and wages. Since the richest 10% of the country owns 84% of stock, the people benefiting from this are the same people who already have more.
So the question remains: How much should we expect companies and the people at the top to give back? After I dug into the numbers, I see the biggest companies in the US giving back to our communities in ways that seem hollow and not up to the standards this country was built on. And I challenge you to ask a deeper question: What will it take to convince companies and the people at the top to start acting like they’re part of the communities that live, breathe, and work inside their walls?
| Company | 2015 Giving (Cash Contributions) | 2015 Net Income (Attirubtable to; $Millions) | 2015 % Income | 2015 Annual Revenue ($Millions) | 2015 Percent of Revenue Reinvested in Communities | Income/Revenue Source |
| Gilead Sciences | $446.70 | $12,100 | 3.69% | $32,600 | 1.37% | gilead.com |
| Walmart | $301.00 | $120,570 | 0.25% | $485,650 | 0.06% | marketwatch.com |
| Wells Fargo | $281.30 | $22,894 | 1.23% | $86,057 | 0.33% | wellsfargomedia.com |
| Goldman Sachs Group | $276.40 | $6,080 | 4.55% | $33,820 | 0.82% | goldmansachs.com |
| ExxonMobil | $268.00 | $16,150 | 1.66% | $259,488 | 0.10% | exxonmobil.com |
| Chevron | $225.00 | $4,587 | 4.91% | $129,925 | 0.17% | chevron.com |
| JP Morgan Chase | $224.00 | $24,442 | 0.92% | $96,543 | 0.23% | jpmorganchase.com |
| Bank of America | $168.50 | $15,888 | 1.06% | $83,416 | 0.20% | bankofamerica.com |
| Alphabet | $167.80 | $16,384 | 1.02% | $74,989 | 0.22% | abc.xyz |
| Citigroup | $142.80 | $17,200 | 0.83% | $68,500 | 0.21% | citigroup.com |
| Microsoft | $135.20 | $12,193 | 1.11% | $93,580 | 0.14% | microsoft.com |
| Merck | $132.50 | $4,442 | 2.98% | $39,489 | 0.34% | sec.gov |
| Coca-Cola | $117.30 | $7,351 | 1.60% | $44,294 | 0.26% | coca-colacompany.com |
| AT&T | $112.90 | $13,687 | 0.82% | $146,801 | 0.08% | att.com |
| Target | $111.50 | $3,321 | 3.36% | $73,785 | 0.15% | target.com |
| General Mills | $105.00 | $1,221 | 8.60% | $17,630 | 0.60% | sec.gov |
| Pfizer | $93.30 | $6,960 | 1.34% | $48,851 | 0.19% | pfizer.com |
| Kroger | $76.50 | $3,576 | 2.14% | $109,830 | 0.07% | kroger.com |
| PNC Financial | $72.00 | $4,143 | 1.74% | $15,225 | 0.47% | thepncfinancialservicesgroupinc.com |
| Morgan Stanley | $62.50 | $908 | 6.88% | $35,200 | 0.18% | morganstanley.com |